Date: Fri, Nov 14, 2025 | 11:10 AM GMT
The cryptocurrency market continues to absorb heavy selling pressure as both Bitcoin (BTC) and Ethereum (ETH) plunged over 6% and 9% respectively in the past 24 hours. The broader correction triggered more than $1.11 billion in liquidations , with long positions suffering the bulk of the damage — over $978 million wiped out in a single session.
This wave of volatility has put significant pressure on major altcoins, including the Layer-1 token Sui (SUI), which is currently down over 10%.
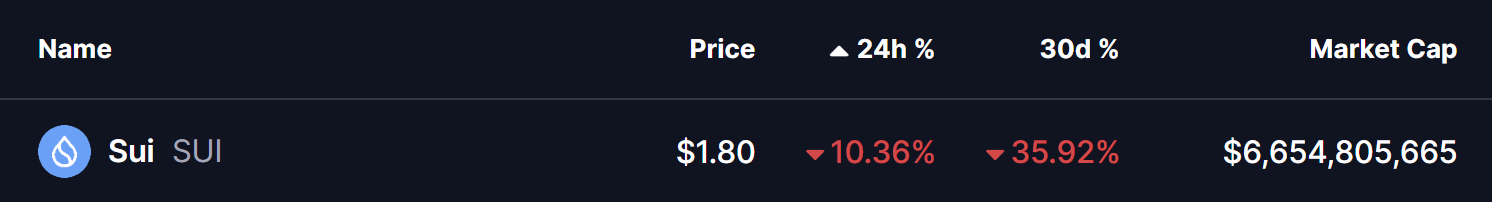 Source: Coinmarketcap
Yet beneath the sharp dip, the chart is revealing something particularly interesting — SUI’s current structure appears to be mirroring a bullish fractal previously seen on Solana (SOL) just before its explosive breakout in late 2024. This resemblance suggests that SUI may be preparing for a similar reversal setup if key levels hold.
Fractal Setup Hints at a Bullish Reversal
As the chart illustrates, SUI’s recent price action looks strikingly similar to Solana’s consolidation phase last year. Solana spent months trapped inside a broad descending triangle, repeatedly testing the same base support range while remaining below its 200-day moving average.
Eventually, SOL reclaimed the 200-day MA and broke through the downtrend line, triggering a sharp upside burst of over 46%. That breakout flipped market sentiment and kicked off a sustained bullish phase.
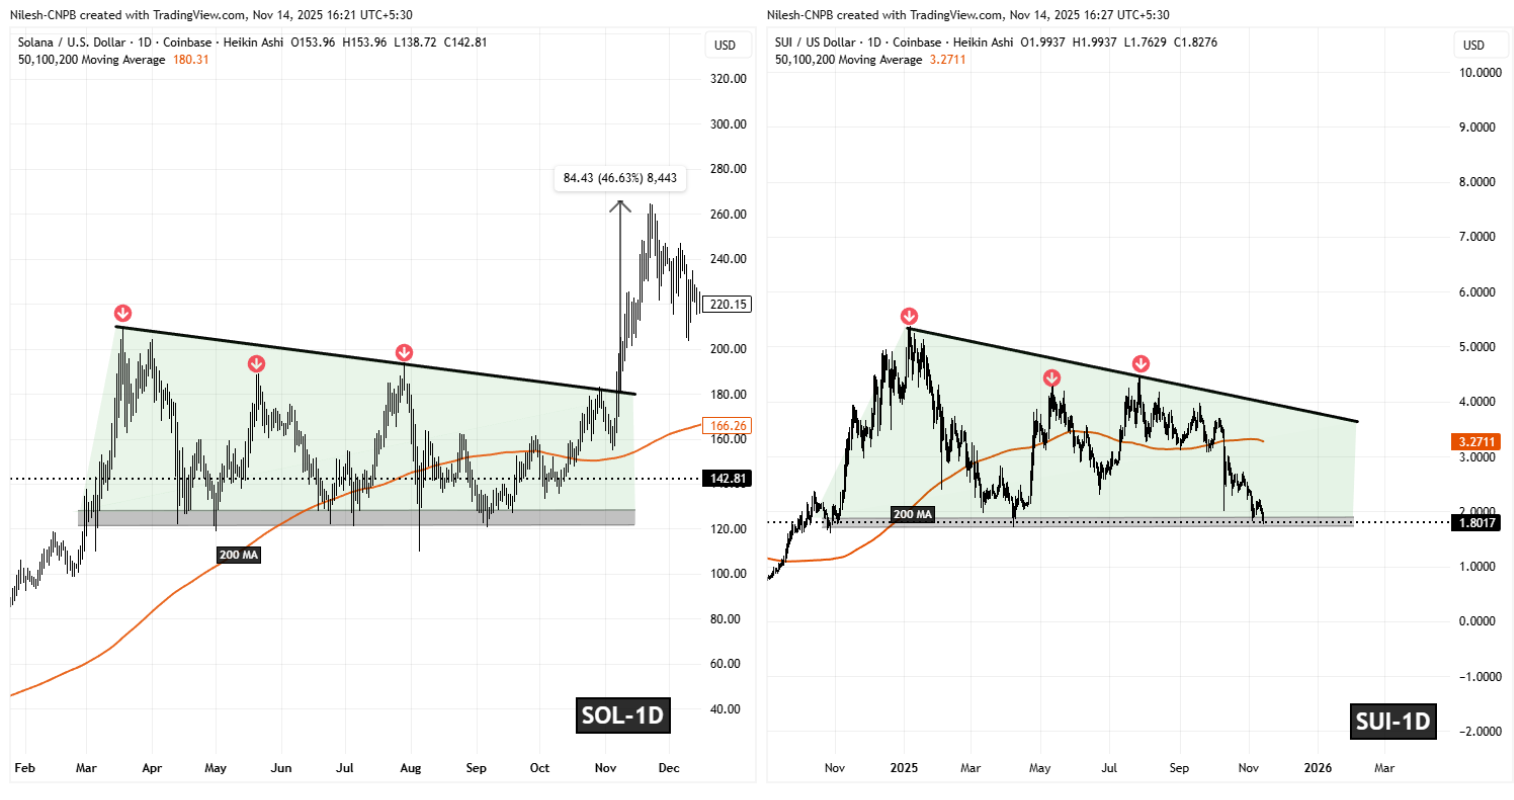 SOL and SUI Fractal Chart /Coinsprobe (Source: Tradingview)
SUI now appears to be forming the same descending triangle-based accumulation structure. Price is testing a crucial historical support zone between $1.71 and $1.91, a region where buyers have stepped in multiple times to defend the range. Despite the broader market weakness, this zone continues to act as SUI’s backbone.
What’s Next for SUI?
If SUI continues to follow Solana’s previous fractal behavior, the current structure could represent an early accumulation zone before a larger upside move. Holding above the $1.71–$1.91 support area would be the first major signal that the downside momentum is slowing.
From here, the next critical step would be a retest of the 200-day moving average near $3.27. A successful reclaim of this level would dramatically improve the bullish outlook and potentially set the stage for an upside breakout above the descending trendline resistance.
A confirmed breakout from the triangle would open the doors for a much larger rally, potentially targeting the $6.80–$7.00 region, which aligns with previous resistance and matches the type of expansion Solana saw after its breakout.
However, traders should remain mindful that fractals are observational — not guarantees. Market sentiment, liquidity conditions, and macro events will play a decisive role in determining whether SUI follows through with the expected pattern or forms a deviation.