Stunning Data: Bitcoin and Gold Have Absolutely No Correlation!

Source: The DeFi Report
Original Title: Does Bitcoin Follow Gold?
Compiled and organized by: BitpushNews
Year-to-date (YTD), gold has risen by 39%, while bitcoin has only increased by 19%. The last time gold outperformed bitcoin in a bull market was in 2020. In the first half of that year, gold rose by 17%, while bitcoin increased by 27%.
So what about the second half of 2020? Bitcoin soared by 214%, while gold only rose by 7%.
This inevitably raises the question: Are we in a similar stage today, with bitcoin about to experience a remarkable outperformance?
This report will delve into the relationship between bitcoin and gold, revealing everything you need to know.
Let's get started.
Correlation Analysis
What Drives Gold Prices?
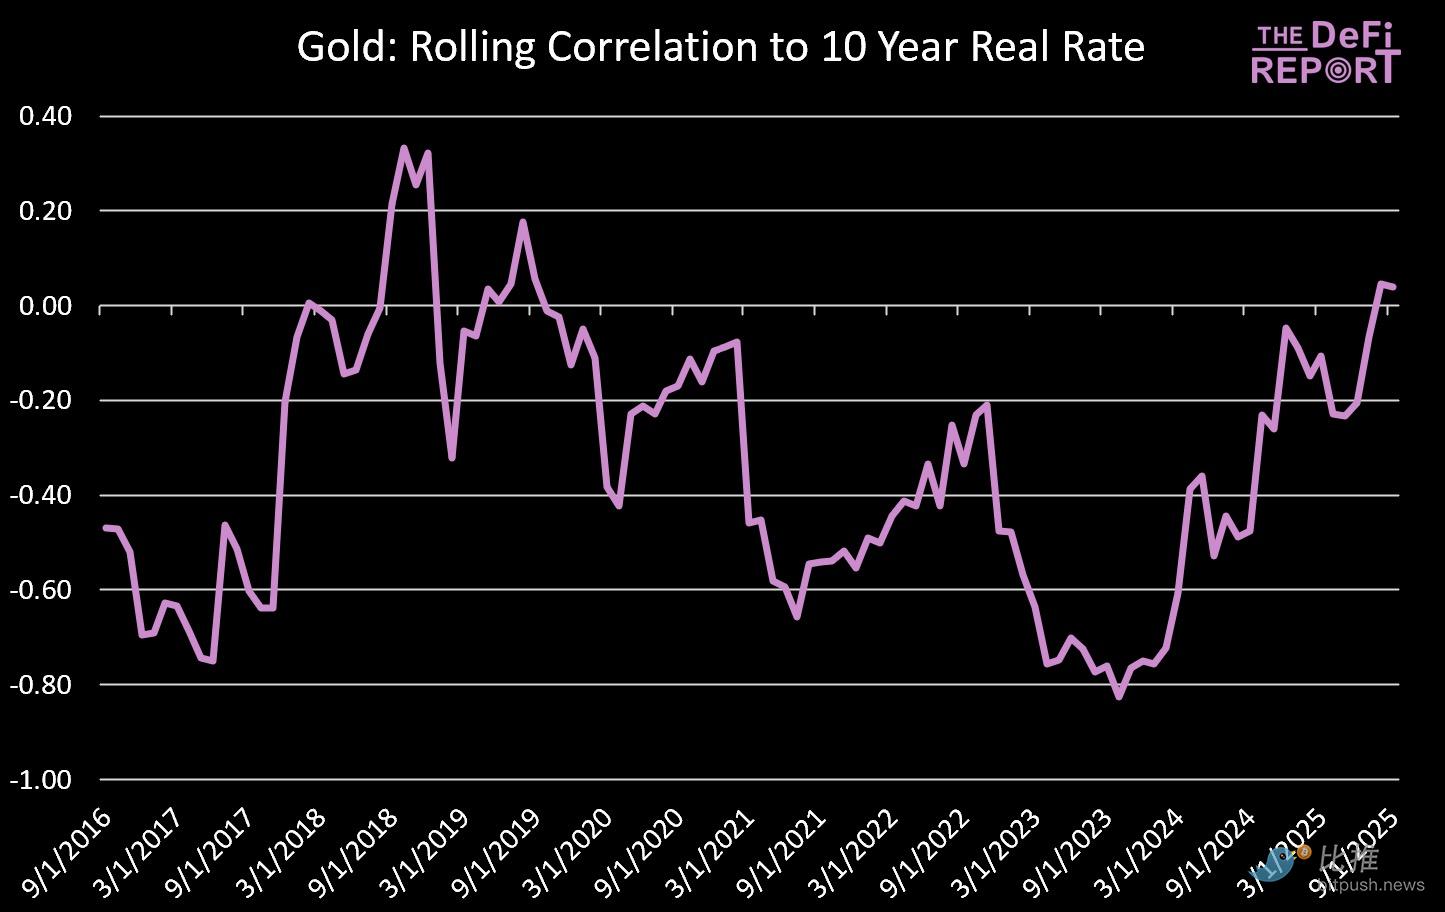
Gold vs. 10-Year Real Yield Data Source: The DeFi Report
The chart above tells us that there is a negative correlation between gold prices and real interest rates (based on monthly return changes and 10-year real yield changes).
Simply put:
-
When real interest rates fall (the gap between nominal yields and inflation narrows), gold tends to perform well.
-
When real interest rates rise (yields increase relative to inflation), gold tends to struggle (because gold itself does not generate yield).
Nevertheless, this relationship has recently decoupled, with gold and real interest rates rising together—a move possibly triggered after the U.S. kicked Russia out of the SWIFT system in February 2022.
Currently, the R² value is 0.156, which means that during this period, 15.6% of gold's price movement can be statistically explained by changes in real interest rates.
Significance:
We are entering a period where real interest rates may decline—a historically favorable setup for gold. For investors, this suggests that as inflation expectations stabilize above 2% and nominal yields fall, gold’s upward momentum may persist.
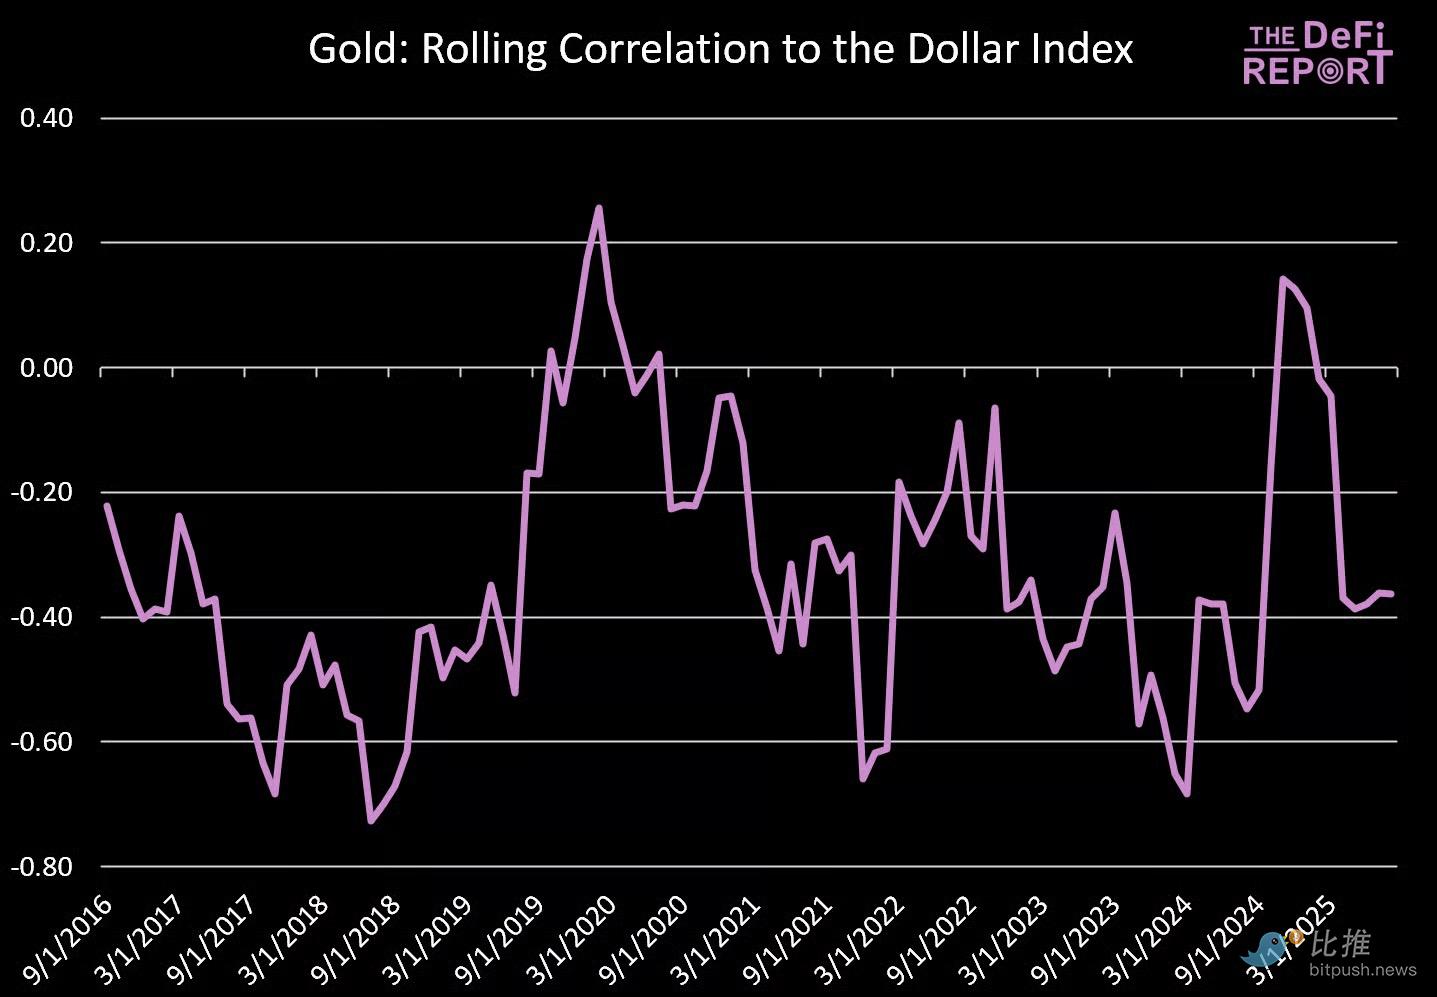
Gold vs. U.S. Dollar Index Data Source: The DeFi Report, FRED
Similar to its relationship with real interest rates, gold has also historically maintained a negative correlation with the U.S. Dollar Index.
-
When the dollar falls, gold tends to rise (as is currently the case).
-
When the dollar strengthens, gold usually comes under pressure.
The R² value is 0.106, indicating that about 10.6% of gold’s price movement during this period can be statistically explained by fluctuations in the dollar.
Bitcoin vs. 10-Year Real Yield
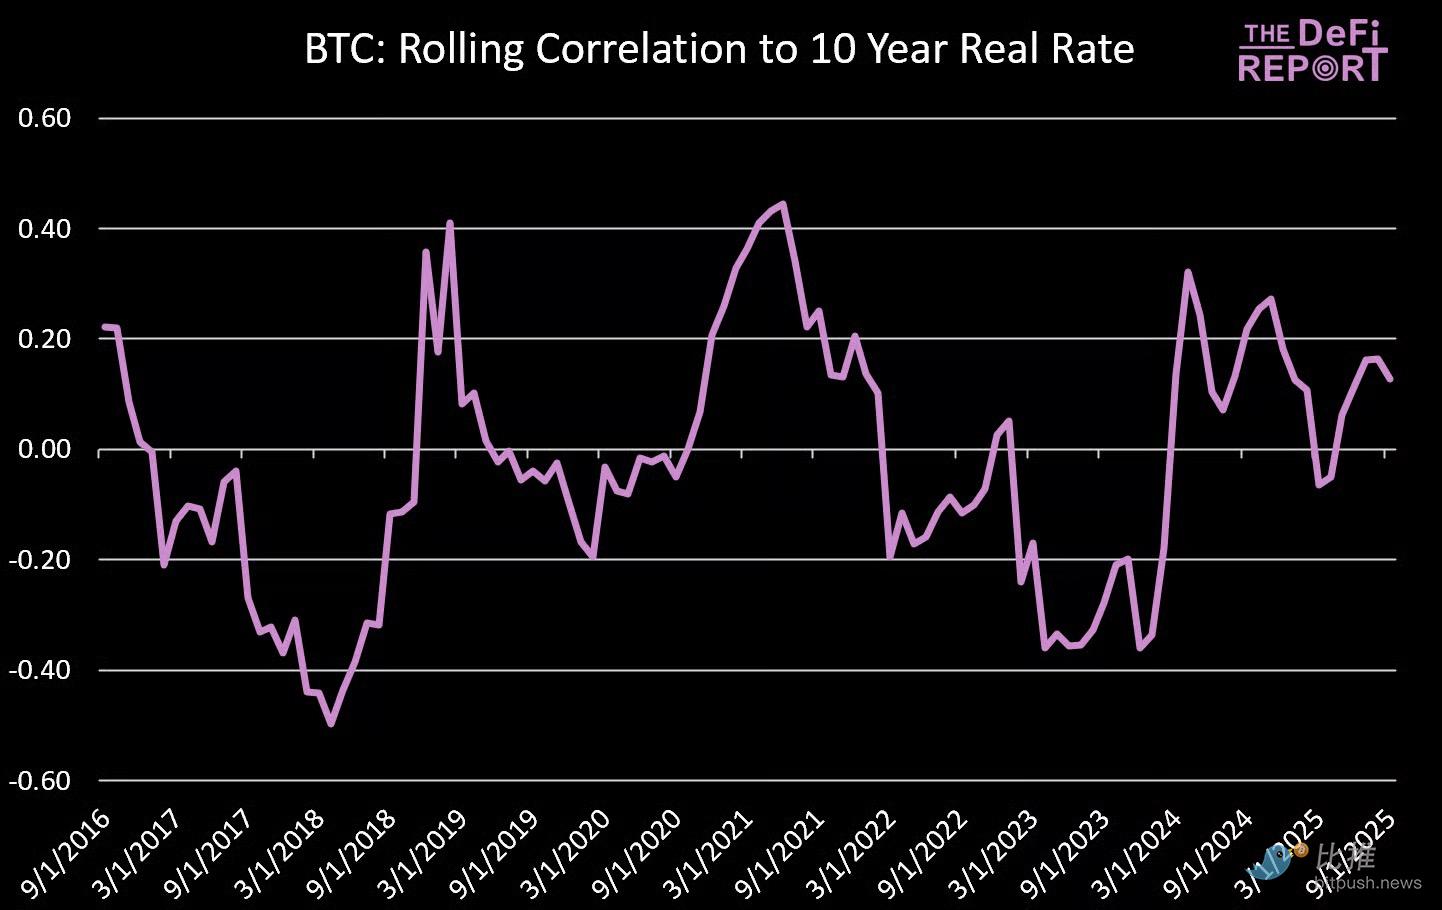
Data Source: The DeFi Report, FRED
Unlike gold, there is no significant relationship between bitcoin and the 10-year real yield.
Sometimes, bitcoin rises as real yields fall. At other times, the opposite occurs. This inconsistency suggests that bitcoin’s price movement is not driven by the same macroeconomic factors that affect gold.
The R² value of 0.002 confirms this—real yields can hardly explain bitcoin’s returns.
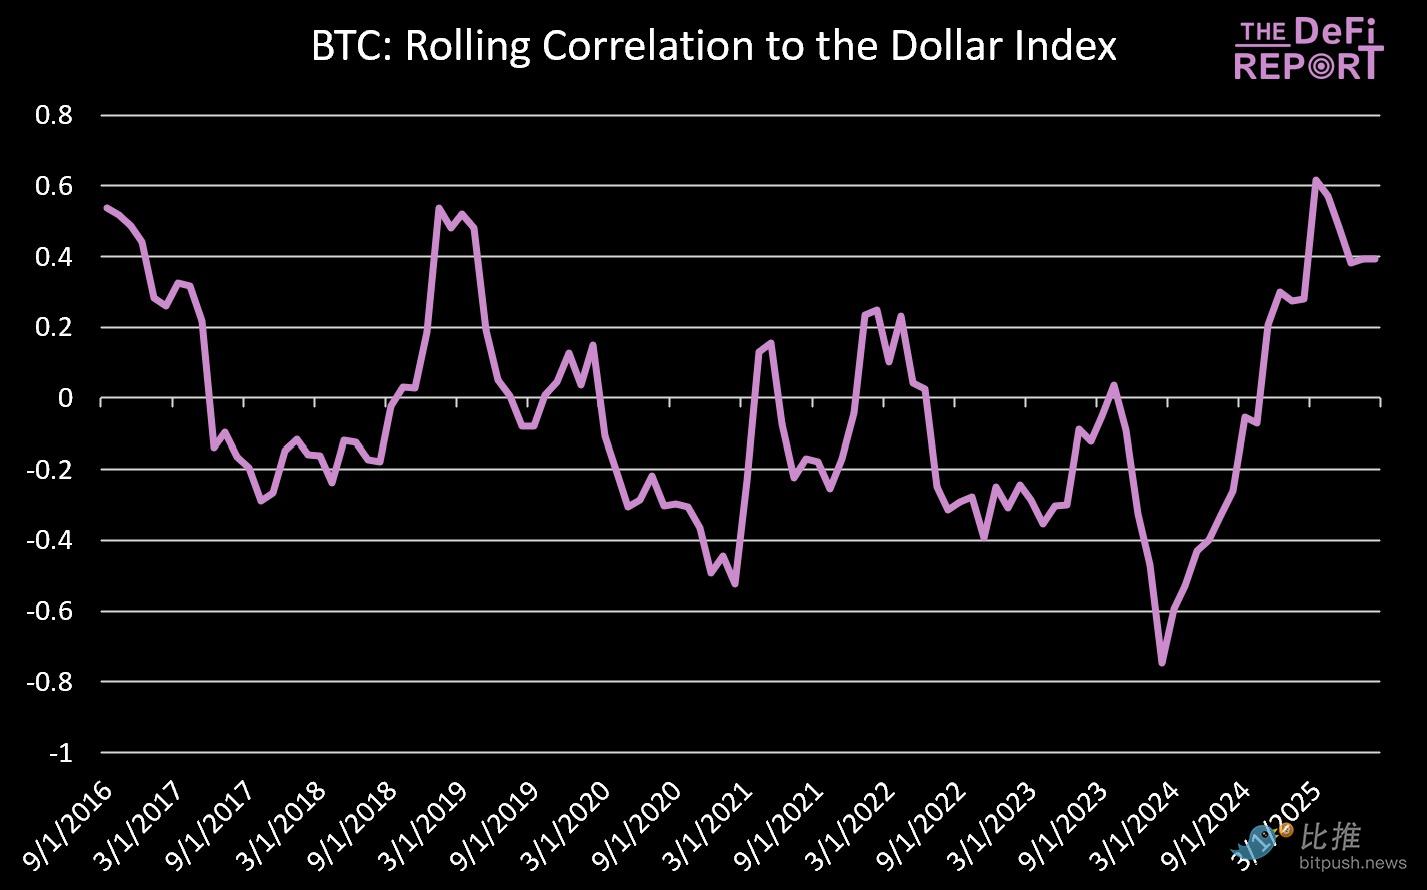
Bitcoin vs. U.S. Dollar Index
Data Source: The DeFi Report, FRED
There is also no consistent relationship between bitcoin’s price movement and the U.S. Dollar Index.
Sometimes, bitcoin is negatively correlated with the dollar (rising when the dollar weakens), while at other times, it rises alongside the dollar. This inconsistency highlights that bitcoin is not driven by the same currency dynamics that affect gold.
The R² value of 0.011 reinforces this point—the dollar can only explain 1% of bitcoin’s returns.
Significance:
Unlike gold (which is typically measured from the perspective of dollar strength or weakness), bitcoin’s drivers are different: adoption cycles, liquidity flows, on-chain reflexivity, and other unique factors/narratives.
Its lack of correlation with the dollar further confirms that bitcoin is becoming a unique asset class, not just “digital gold.”
Bitcoin vs. Nasdaq Index
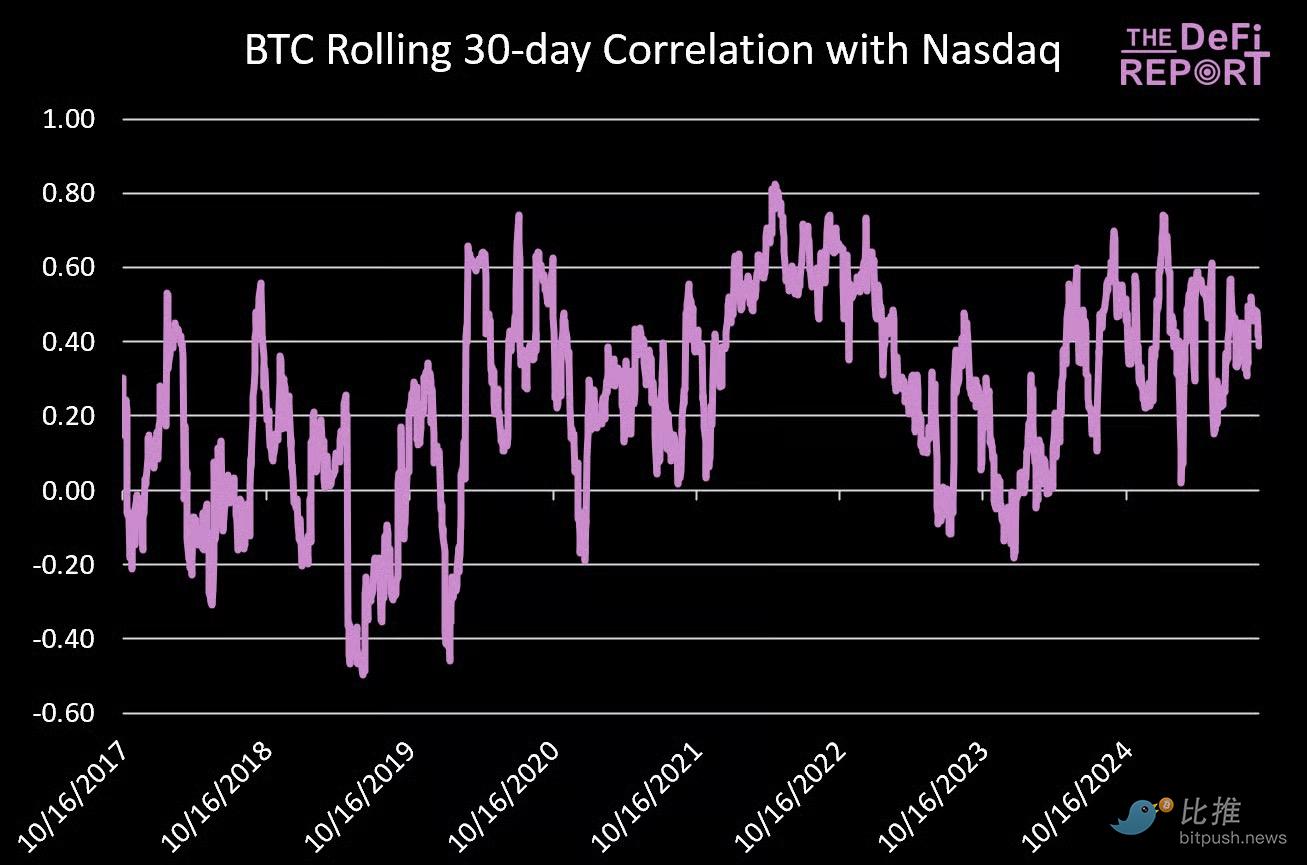
Data Source: The DeFi Report
Compared to macro drivers (such as real yields or the dollar), bitcoin shows a stronger positive correlation with the Nasdaq Index.
Since 2017, this relationship has remained consistent, with an R² of 0.089, meaning about 8.9% of bitcoin’s price movement can be statistically explained by fluctuations in the Nasdaq Index.
By comparison, gold’s R² with the Nasdaq Index during the same period is only 0.006—less than 1% of gold’s returns are related to tech stock performance.
Correlation Between Bitcoin and Gold
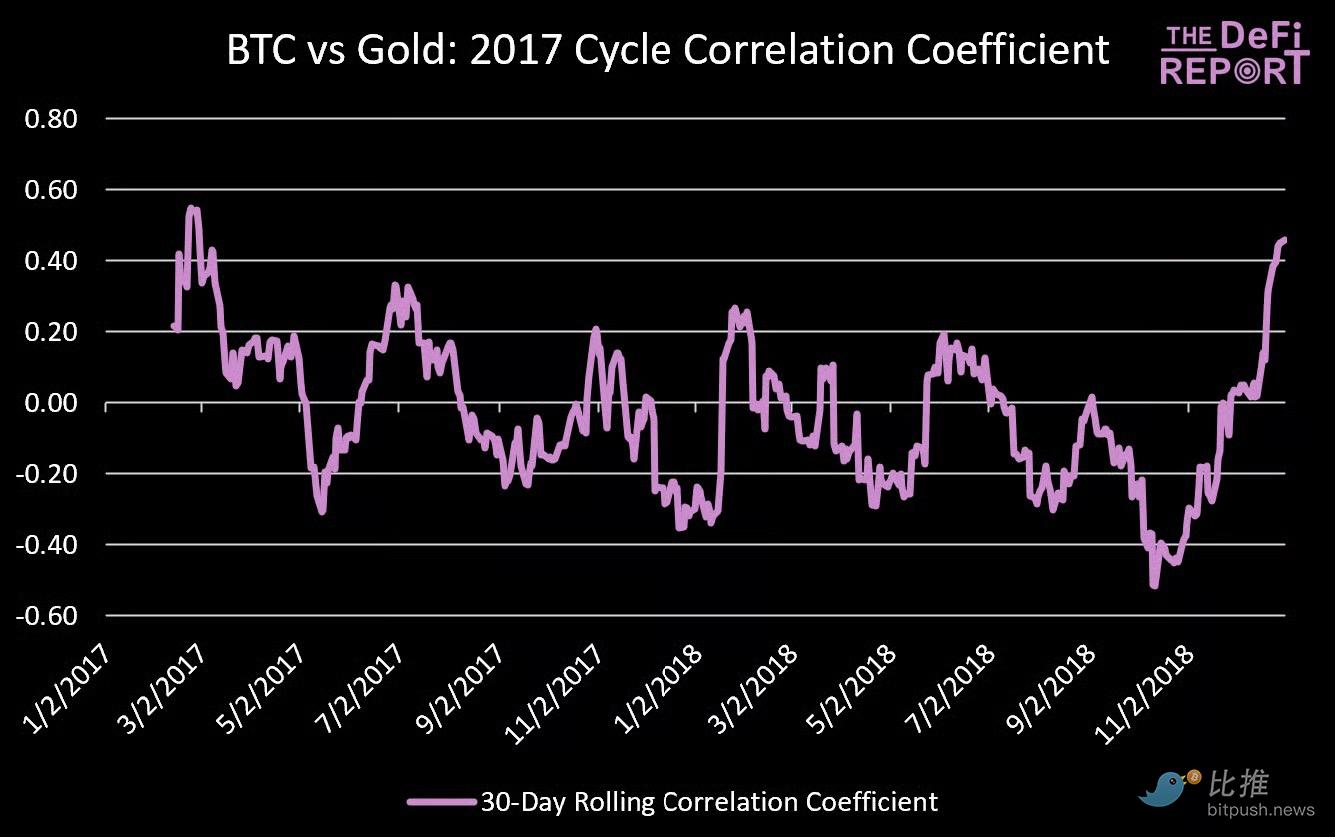
2017 Cycle Data Source: The DeFi Report
During the 2017 bull market cycle, bitcoin and gold showed a weak correlation.
The R² for this period was only 0.033, meaning that from 2017 to 2018, gold could only explain about 3.3% of bitcoin’s price movement.
2021 Cycle
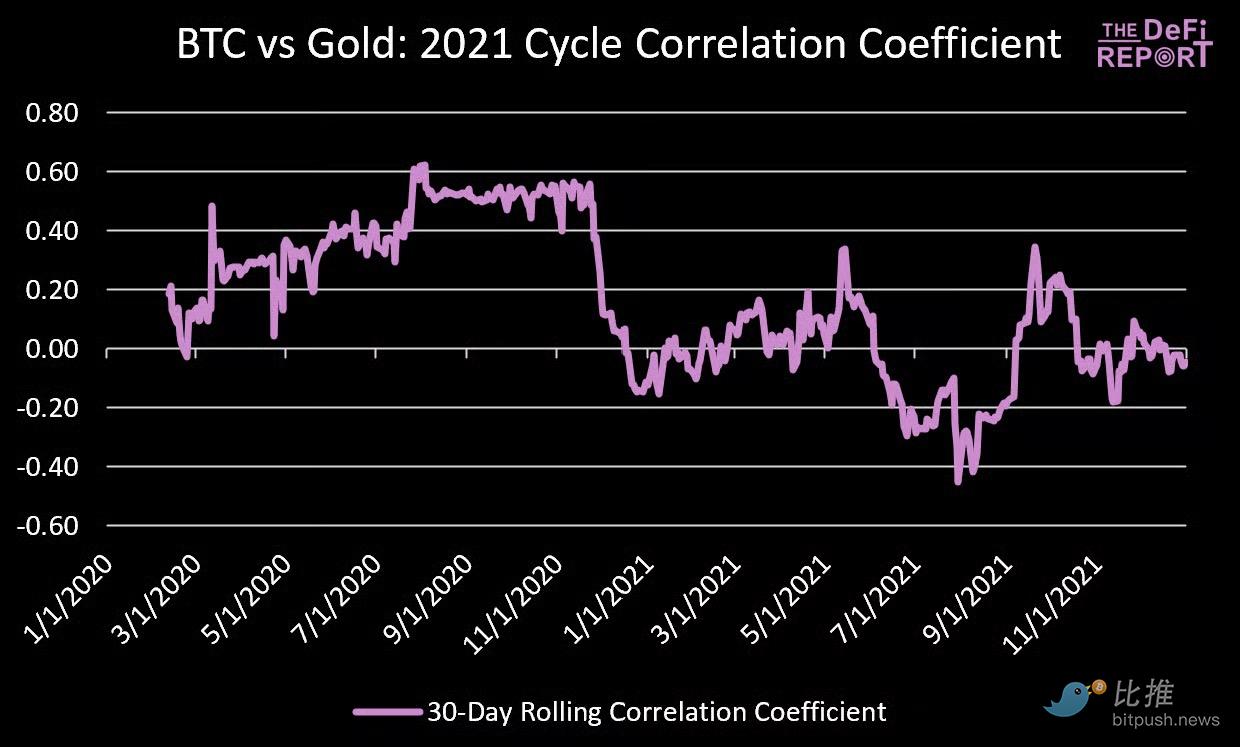
Data Source: The DeFi Report
Based on 30-day rolling correlation, bitcoin and gold showed a slightly stronger relationship, especially in 2020, when both assets rose together.
2025 Cycle
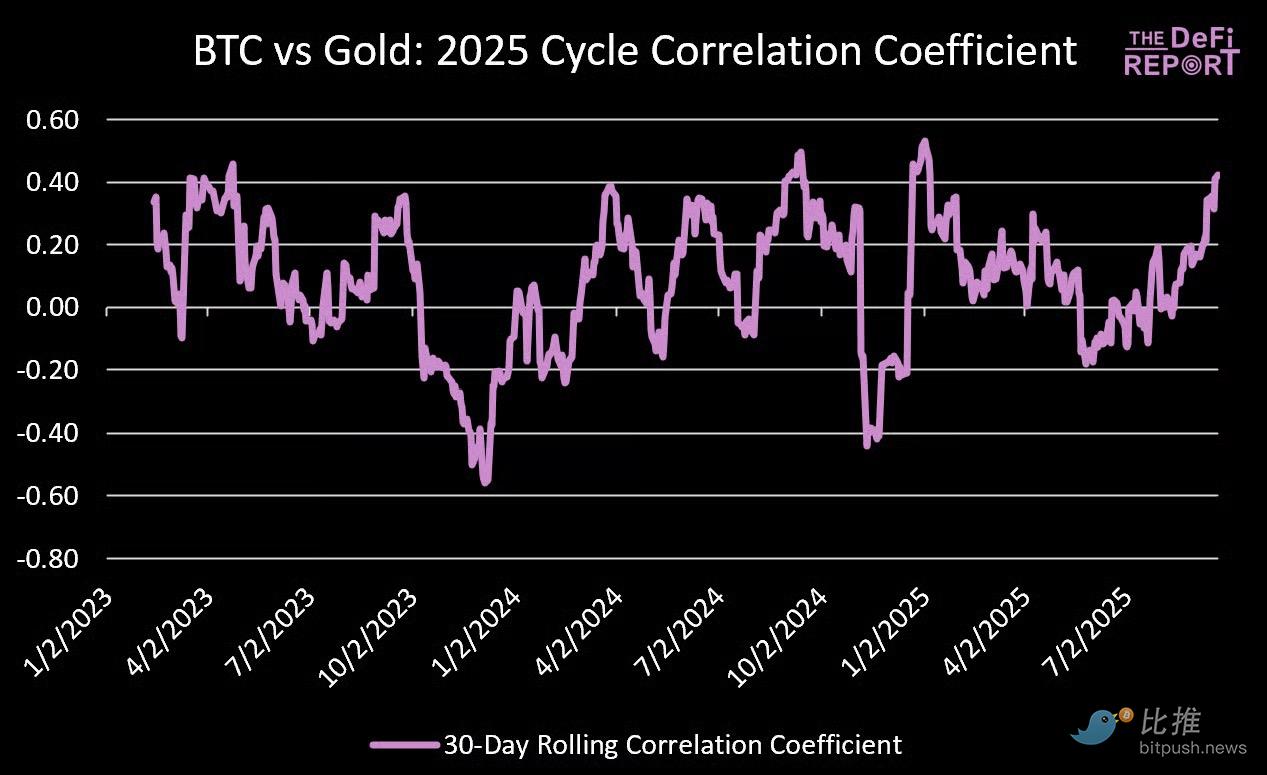
Data Source: The DeFi Report
In this cycle, the correlation between the two has weakened.
The R² for this period is 0.015—meaning that gold can only explain 1.5% of bitcoin’s price movement in this cycle.
Beta Coefficient Analysis
As mentioned above, the correlation between bitcoin and gold is very weak.
So what about the beta coefficient? Is bitcoin a “leveraged gold bet”?
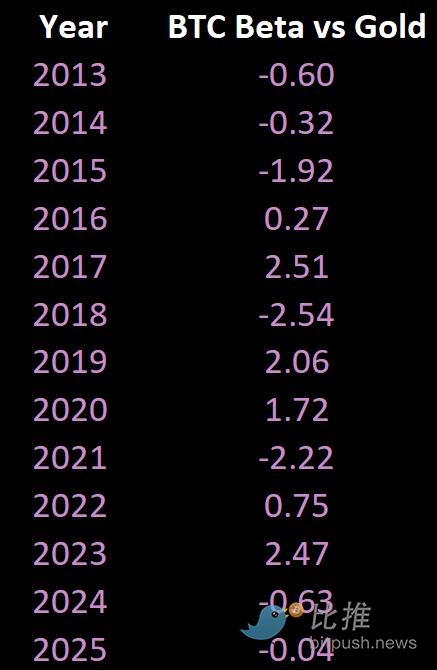
Data Source: The DeFi Report (monthly)
The answer is complicated. It did play such a role in 2017, 2019, 2020, and 2023.
However, in 2015 (a down year for bitcoin), 2018 (another down year), and 2021 (a year of significant bitcoin gains), bitcoin’s price movement was in the opposite direction to gold.
Bitcoin vs. Gold Returns
“Gold bugs” are ecstatic, as the asset has outperformed bitcoin year-to-date (39% vs 19%). Since January 1, 2023, gold has risen by 102%, and the gold mining sector has performed even better (VanEck’s Junior Gold Miner ETF, GDXJ, is up 122% YTD).
We have even seen some crypto investors start to add gold to their portfolios.
But if you own bitcoin, do you really need to allocate gold in your portfolio?
This part of the report aims to answer that question.
Data Source: The DeFi Report
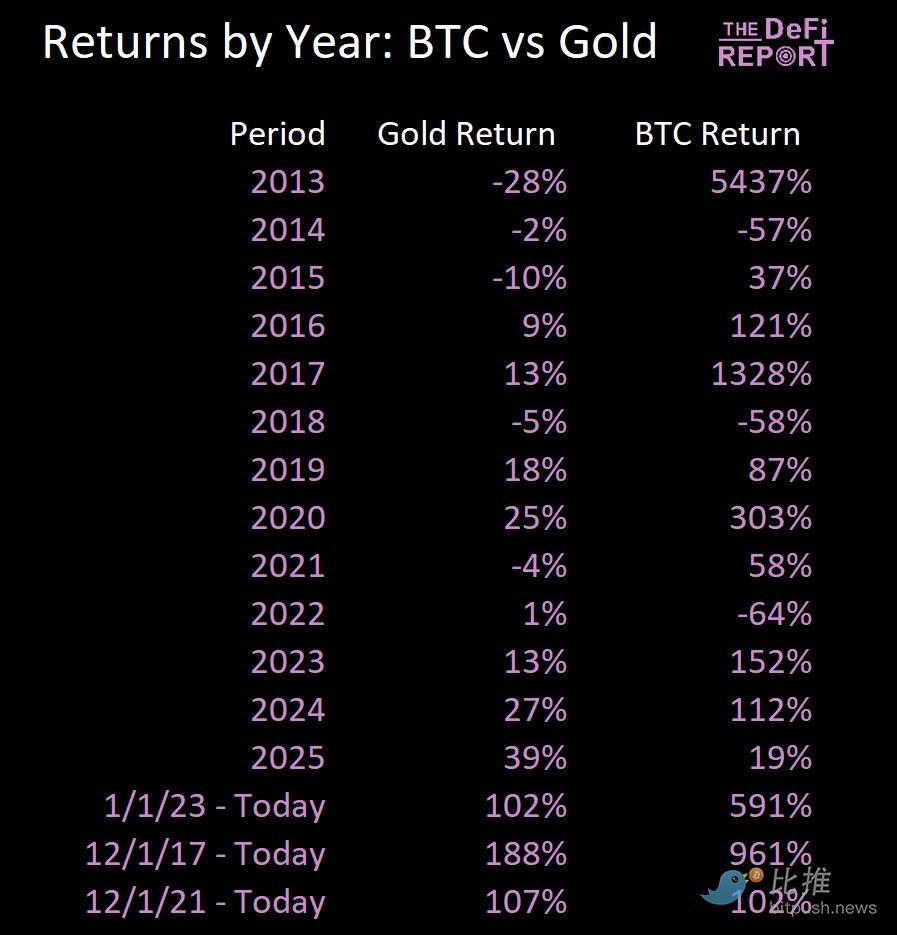
Data Source: The DeFi Report
Compared to gold, bitcoin has historically delivered superior returns (and volatility).
But how does it compare to gold when we adjust for risk?
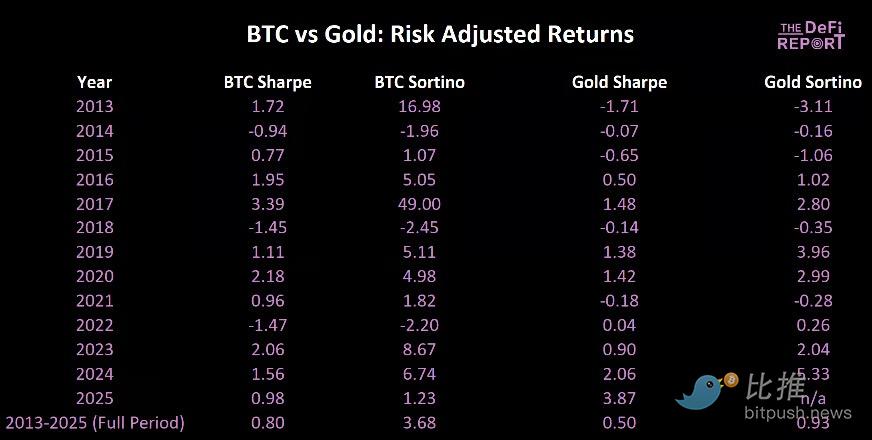
Risk-Adjusted Returns
-
Sharpe Ratio: Measures the return per unit of risk (measured by volatility, including both upside and downside).
-
Sortino Ratio: Measures the return per unit of downside risk. Unlike the Sharpe Ratio, it only considers “bad” volatility (i.e., downside volatility).
Data Source: The DeFi Report
We can see that bitcoin tends to generate outstanding risk-adjusted returns in bull market years (2017, 2020, 2023). But in bear market years (2014, 2018, 2022), its Sharpe Ratio also plunges into negative territory due to its high volatility.
That said, the Sharpe Ratio is not the best metric for measuring bitcoin, as it penalizes all volatility (including upside volatility).
This is why we prefer to use the Sortino Ratio for bitcoin (it only penalizes downside volatility).
We can see that bitcoin has produced excellent Sortino Ratios, indicating that its volatility is a feature, not a bug.
For reference, a Sortino Ratio above 2.0 is considered outstanding.
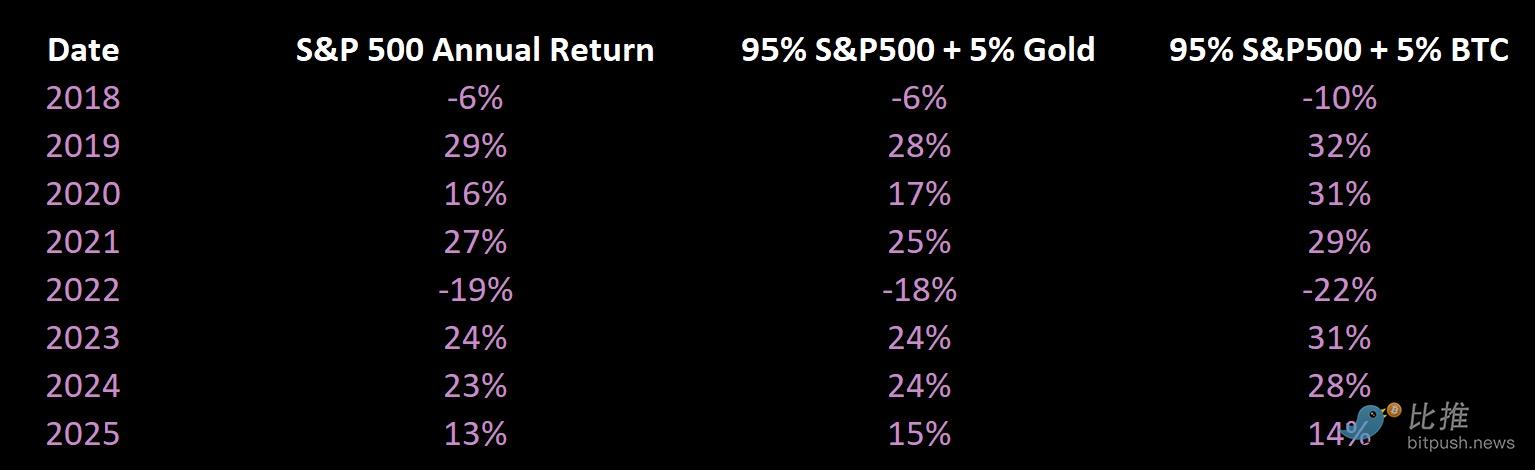
The Impact of a 5% Allocation
 Data Source: The DeFi Report
Total returns since January 1, 2018 (5% allocation):
-
100% S&P 500 Index: 149%
-
95% S&P 500 + 5% Gold: 152%
-
95% S&P 500 + 5% Bitcoin: 199%
If the allocation to bitcoin and gold is 10%:
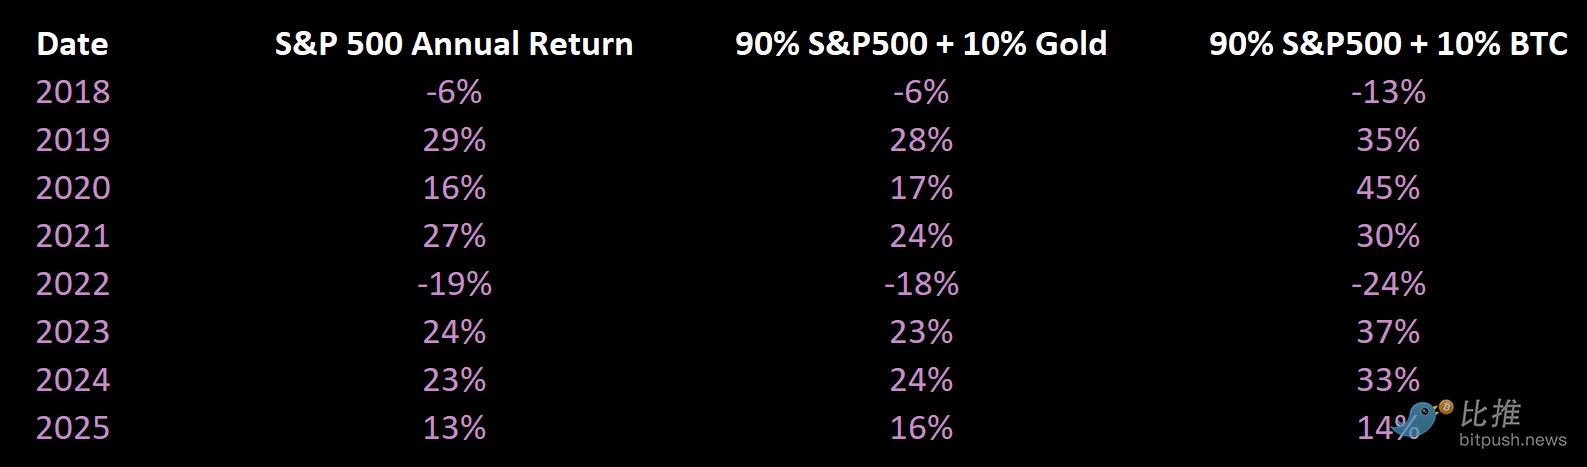
Total returns since January 1, 2018 (10% allocation):
-
100% S&P 500 Index: 149%
-
90% S&P 500 + 10% Gold: 155%
-
90% S&P 500 + 10% Bitcoin: 253%
If you are primarily a crypto investor, should you own gold?
In our view, if you are seeking excess returns and can tolerate some volatility, bitcoin is the superior asset. If your primary goal is wealth preservation, then gold certainly has a place.
In many ways, we believe the merits of these two assets are generationally specific. Millennials and Gen Z tend to prefer bitcoin for its asymmetric upside potential. Baby boomers may prefer gold for its inflation-hedging properties (less upside, but a proven track record of wealth preservation).
We have held gold in the past, but for the following reasons, we have shifted our “hard money” allocation 100% to bitcoin:
-
Asymmetric upside potential: Bitcoin’s global penetration is extremely low compared to gold.
-
Superior scarcity: A hard cap of 21 million coins, with supply inelastic to demand.
-
Portability: Bitcoin is a hard money asset that also functions as a global payment network and accounting system.
-
Divisibility: Gold is not easily divisible or fractionalized.
-
Transparency and verifiability: Gold’s circulating supply is unknown, and verifying its purity and ownership requires third-party trust.
-
Liquidity and 24/7/365 market access.
-
Demographics: Bitcoin is global and has a stronger brand among younger generations.
-
Financialization: Bitcoin is increasingly being integrated into the global financial system.
Conclusion
During the 2021 cycle, it felt like “gold was leading bitcoin.” However, it is difficult to find conclusive evidence of a lasting connection between these two assets.
Bitcoin is often referred to as “digital gold” because of its “hard money” characteristics.
But it trades almost nothing like gold—gold serves as an inflation hedge due to its negative correlation with the dollar and real interest rates.
In contrast, bitcoin is emerging as an independent asset class—driven by technological adoption, financialization, global liquidity, reflexivity, and adoption cycles.
Disclaimer: The content of this article solely reflects the author's opinion and does not represent the platform in any capacity. This article is not intended to serve as a reference for making investment decisions.
You may also like
Mars Morning News | SEC Expected to Issue "Innovation Exemptions" for the Crypto Industry in "About a Month"
The SEC is expected to issue an innovation exemption for the crypto industry. The UK "Digital Assets and Other Property Act" has come into effect. BlackRock's CEO revealed that sovereign wealth funds are buying bitcoin. Bank of America recommends clients allocate to crypto assets. Bitcoin selling pressure is nearing its end. Summary generated by Mars AI. The accuracy and completeness of this summary are still being improved as the Mars AI model continues to iterate.
a16z: Inefficient governance and dormant tokens pose a more severe quantum threat to BTC.
Deep Reflection: I Wasted Eight Years in the Crypto Industry
In recent days, an article titled "I Wasted Eight Years in the Crypto Industry" has garnered over a million views and widespread resonance on Twitter, directly addressing the gambling nature and nihilistic tendencies of cryptocurrencies. ChainCatcher now translates this article for further discussion and exchange.