

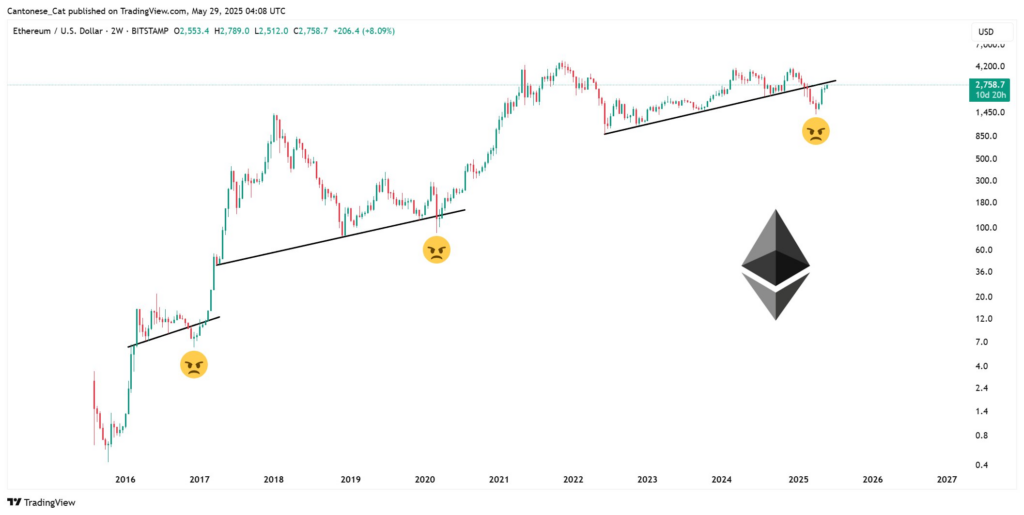
- Ethereum’s price hit $2,758 near resistance after bouncing off support near $2,512 showing cautious market strength.
- Trendline breaks in 2017 and 2022 led to over 50% price drops highlighting Ethereum’s recurring correction risks.
- Recent price action mirrors past patterns where rebounds followed breaks but risks of further decline remain real.
Ethereum (ETH) faces crucial trendline tests after recent price fluctuations. The chart shows sharp price corrections at key support levels since 2016. These movements raise a pivotal question: can Ethereum sustain its long-term uptrend?
 Source:
X
Source:
X
Historical Price Corrections and Trendlines
Since 2016, Ethereum’s price has experienced multiple corrections, breaking ascending trendlines. The first notable correction occurred around 2017, marking a significant pullback from early growth phases. This drop was followed by a rebound, but with a clear break below a key ascending support line.
The second critical correction emerged around 2022. Like the prior correction, ETH price broke below another rising trendline, signaling a potential weakening in its upward momentum. These breaks suggest Ethereum’s price faces challenges maintaining its bullish trajectory over time.
Each correction corresponded with sharp declines of over 50% in price, according to the chart’s scale. The losses came despite overall positive long-term growth, demonstrating Ethereum’s inherent volatility. These corrections remain a major factor for traders and analysts monitoring ETH’s price action.
Recent Price Action and Current Support Tests
The most recent price data shows Ethereum testing an ascending support line again, similar to previous cycles. Price action dipped below this trendline but quickly rebounded, closing near $2,758. This area appears crucial as a short-term pivot point.
Price highs reached near $2,789, suggesting resistance is present close to current levels. This resistance may prevent ETH from reclaiming higher prices unless strong buying interest emerges. Meanwhile, support near $2,512 acted as a price floor during recent trading sessions.
Volume and volatility patterns, visible from candle sizes, indicate active market participation. Traders appear cautious as ETH approaches this critical trendline, mirroring past moments when price either rebounded or declined significantly.
Analysts focus on this level as a key determinant of Ethereum’s short to medium-term direction. Should ETH fail to hold this support, the price may revisit lower levels around $1,500 to $1,700, according to past chart behavior.
Implications for Traders and Investors
The repeating pattern of trendline breaks poses questions about Ethereum’s near-term strength. Investors must consider how these corrections affect portfolio risk, especially with ETH’s historically high volatility. Each trendline breach marked significant price drawdowns, underscoring potential downside risks.
At the same time, rebounds after these breaks suggest strong underlying demand. Ethereum’s overall trajectory since 2016 remains upward despite temporary setbacks. This resilience is key for long-term holders but challenges shorter-term traders seeking stable gains.
Traders use these trendlines to time entries and exits, balancing between risk and reward. The recent bounce off support offers a possible buying opportunity, but the proximity to resistance near $2,789 warrants caution.
Moreover, Ethereum’s role in decentralized finance and smart contracts keeps market interest elevated. Price movements often reflect broader crypto market trends alongside Ethereum-specific developments.