Bitget App
スマートな取引を実現
暗号資産を購入市場取引先物Bitget EarnWeb3広場もっと見る
取引
現物
暗号資産の売買
マージン
資本を増幅し、資金効率を最大化
Onchain
Going Onchain, without going Onchain!
Bitget Convert
取引手数料ゼロ、スリッページなし
探索
Launchhub
チャンスを先取りし、スタートラインで優位に立つ
コピートレード
エリートトレーダーをワンクリックでコピー
Bots
シンプルで高速、そして信頼性の高いAI取引ボット
取引
USDT-M 先物
USDTで決済される先物
USDC-M 先物
USDCで決済される先物
Coin-M 先物
暗号資産で決済される先物
探索
先物ガイド
初心者から上級者までを対象とした先物取引のガイドブック
先物キャンペーン
豪華な報酬が待っている
商品一覧
資産を増やすための多彩な商品
シンプルEarn
好きなタイミングで入出金&リスクゼロで柔軟なリターンを獲得
On-chain Earn
元本をリスクにさらさずに、毎日利益を得る
仕組商品
市場の変動を乗り越えるための強力な金融イノベーション
VIP & ウェルスマネジメント
スマートなウェルスマネジメントのためのプレミアムサービス
借入
高い資金安全性を備えた柔軟な借入
United States Dollarの価格

United States Dollarの‌価格USD

未上場
¥0.002542JPY
0.00%1D
United States Dollar(USD)の価格は日本円では¥0.002542 JPYになります。
データはサードパーティプロバイダーから入手したものです。このページと提供される情報は、特定の暗号資産を推奨するものではありません。上場されている通貨の取引をご希望ですか?  こちらをクリック
登録
United States Dollarの価格チャート(JPY/USD)
最終更新:2025-10-18 08:11:24(UTC+0)

United States Dollarの市場情報

価格の推移(24時間)
24時間
24時間の最低価格:¥024時間の最高価格:¥0
過去最高値(ATH):
--
価格変動率(24時間):
価格変動率(7日間):
--
価格変動率(1年):
--
時価総額順位:
--
時価総額:
¥25,422,062.68
完全希薄化の時価総額:
¥25,422,062.68
24時間取引量:
--
循環供給量:
10.00B USD
‌最大供給量:
10.00B USD
‌総供給量:
10.00B USD
流通率:
99%
コントラクト:
63qr9x...RbzvRrC(Solana)
リンク:
暗号資産を購入

現在のUnited States Dollar価格(JPY)

現在、United States Dollarの価格は¥0.002542 JPYで時価総額は¥25.42Mです。United States Dollarの価格は過去24時間で0.00%下落し、24時間の取引量は¥0.00です。USD/JPY(United States DollarからJPY)の交換レートはリアルタイムで更新されます。
1 United States Dollarは日本円換算でいくらですか?
現在のUnited States Dollar(USD)価格は日本円換算で¥0.002542 JPYです。現在、1 USDを¥0.002542、または3,933.59 USDを¥10で購入できます。過去24時間のUSDからJPYへの最高価格は-- JPY、USDからJPYへの最低価格は-- JPYでした。
AI分析
本日の暗号資産市場の注目

暗号市場は2025年10月17日に大きな混乱の状況を示しました。これはマクロ経済の恐れと投資家の心理の大幅な低下によって特徴づけられました。ビットコイン(BTC)とイーサリアム(ETH)はより広範な市場の下落を牽引し、特定のアルトコインはボラティリティにもかかわらず注目すべき動きを見せました。この状況は、流動化の急増と慎重な態度の中の投資家が出てきた中で発生し、一部のアナリストは現在の状況を「蓄積の機会」と見なしました。

市場の下落とマクロ経済の負担

暗号通貨市場は、今日で3日連続して大幅な下落を経験しました。ビットコインは109,000ドルを下回り、一時的に105,231ドルまで落ち込み、イーサリアムは4,000ドルの水準を下回り、3,731ドルまで下落しました。[1] 総市場資本は3.8兆ドルを下回りました。[21] この下落トレンドは、米国の地方銀行での不良債権に関する報告の後に再び浮上した米国銀行セクターへの恐怖感が主な要因となっています。[1] さらに、米国と中国との間の継続的な貿易緊張は、世界市場全体にリスク回避をもたらしました。[5] これにより、「安全への逃避」が引き起こされ、投資家が高リスク資産、特に暗号通貨を避け、代わりに金のようなより安全な避難所を探すこととなり、金は新たな記録高に達しました。[5]

これらの出来事の影響は、流動化の数字にも明らかでした。過去24時間で723百万ドル相当の暗号ポジションが清算され、ほとんどがロングポジションによるものでした。[1] これは、昨週の市場を揺るがした190億ドルの流動化に続くものでした。[5]

投資家の心理が最低に、しかし蓄積に重点

Crypto Fear & Greed Indexが示すように、投資家の心理は最低に達し、年間低水準の24(「恐れ」)に下がりました。[2] Googleでの「ビットコイン」に関する検索関心も数ヶ月で最も低い水準にあり、熱意の低下を反映しています。[2, 4] しかし、Bitwiseのアナリストは、現在の修正を「投資家がパニックになるのではなく、蓄積するための黄金の機会」と見なしています。[2, 4] 彼らは、貿易緊張のような外部要因が下落の主な原因であり、このような期間はしばしば回復サイクルの始まりを示すと主張しています。[2]

アルトコインの動向と技術的進展

アルトコイン市場は今日混合信号を示しましたが、大部分は下落傾向にありました。アルトコインシーズン指数は78から25に落ち込み、アルトコインからビットコインへの明確なローテーションを示唆しています。[1] Render(RENDER)やFilecoin(FIL)などの多くのアルトコインは7%以上の下落を記録しました。[1] ただし、Zora(ZORA)というレイヤー2プロジェクトは18%上昇しました。[1] Chiliz(CHZ)は、バリデーターシステムを改善する予定のSnake8ハードフォークを受けて12%上昇しました。[11] Grayscaleが自身のBittensor Trust向けに米国SECにフォーム10の申請を提出したことを受け、Bittensor(TAO)は36%の急上昇を見せ、広範な機関投資の機会を開くことが予想されています。[11] 一方、Sei(SEI)は供給が増加し価格が圧迫される可能性のある大規模なトークンリリースを控え、注意深く観察されています。[11]

分散型金融(DeFi)分野でも重要な進展がありました。Uniswapは自社のWebアプリケーションにネイティブなSolanaサポートを統合しました。[24] これは、EthereumベースのDEXが非EVMブロックチェーンをサポートする初めての事例であり、EthereumとSolanaの間の相互運用性を大幅に向上させ、UniswapをマルチチェーンのDeFiゲートウェイとして位置づけます。[24] この統合は、Jupiter APIを利用して、100万のSolanaトークン間でシームレスなスワップを可能にします。[24] 一方、批評家は、米国で提案されているリスクの高いDeFiプロトコルの「制限リスト」がイノベーションを妨げ、プロジェクトを海外に移す可能性があると警告しています。[26]

Ethereumエコシステムでも注目すべき活動がありました。ホエールは417百万ドル以上のETHを蓄積し、長期的な信頼感を示しています。[19] さらに、Ethereumは2025年に16,000人の新しい開発者を迎え、ブロックチェーンセクターの成長をリードし、次のSolanaが11,500人の新しい開発者を迎えました。[20]

見通しと重要な日程

市場が不確実性に満ちているにもかかわらず、2025年10月は、11回目のEuropean Blockchain ConventionやBlockchain Life Forumなど、暗号業界の数多くの会議やサミットが予定されている活気ある月であるままです。[3, 6, 7] スポットビットコインETFの承認やSolanaなどのアルトコイン向けの潜在的なスポットETFなどの機関投資の受け入れは、2025年第4四半期の重要な成長ドライバーであると見なされています。[28, 29] Bitwiseのアナリストは、現実の資産のトークン化やDeFiソリューションの成熟が成長を促進する重要なトレンドであることを強調しています。[22, 28, 30]

要約すると、2025年10月17日、暗号市場は価格の低下、流動化圧力、悲観的な投資家心理によって特徴づけられた困難な状況を経験しました。しかし、その裏には、DeFi、アルトコイン、機関の受容といった重要な進展があり、将来の回復と成長の可能性を秘めています。

AIが要約した内容は正確ではない可能性があります。情報は、複数の情報源でご確認ください。上記は投資アドバイスを構成するものではありません。
もっと見る

United States Dollarの価格は今日上がると思いますか、下がると思いますか?

総投票数:
上昇
0
下落
0
投票データは24時間ごとに更新されます。これは、United States Dollarの価格動向に関するコミュニティの予測を反映したものであり、投資アドバイスと見なされるべきではありません。
以下の情報が含まれています。United States Dollarの価格予測、United States Dollarのプロジェクト紹介、開発履歴など。United States Dollarについて深く理解できる情報をご覧いただけます。

United States Dollarの価格予測

2026年のUSDの価格はどうなる?

+5%の年間成長率に基づくと、United States Dollar(USD)の価格は2026年には¥0.002736に達すると予想されます。今年の予想価格に基づくと、United States Dollarを投資して保有した場合の累積投資収益率は、2026年末には+5%に達すると予想されます。詳細については、2025年、2026年、2030〜2050年のUnited States Dollar価格予測をご覧ください。

2030年のUSDの価格はどうなる?

+5%の年間成長率に基づくと、2030年にはUnited States Dollar(USD)の価格は¥0.003326に達すると予想されます。今年の予想価格に基づくと、United States Dollarを投資して保有した場合の累積投資収益率は、2030年末には27.63%に到達すると予想されます。詳細については、2025年、2026年、2030〜2050年のUnited States Dollar価格予測をご覧ください。

Bitgetインサイト

Crypto_navigator
Crypto_navigator
2025/09/28 06:11
Decoding $BLESS: A Deep Dive into Market Structure & K-Line Technicals
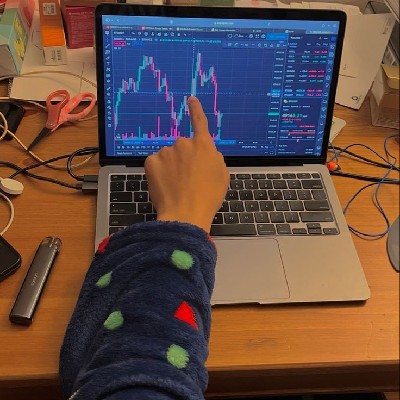
​$BLESS entered the market with the compelling narrative of a DePIN play for edge computing, positioning itself as the token powering a network that aggregates idle CPU/GPU from everyday devices to offer decentralized compute. This vision of cheaper, distributed compute for AI and Web3 has garnered significant attention, though early trading has been marked by extreme volatility. Currently, the token is fluctuating in the low-single cents with substantial daily turnover, indicating both speculative interest and robust liquidity. CoinMarketCap and CoinGecko generally align on live price and market statistics, showing prices around $0.03–$0.05, a circulating supply of approximately 1.84 billion, and daily volumes in the tens of millions. ​At its core, $BLESS , developed by TX Labs, aspires to be a global decentralized edge compute layer. Node operators contribute their device cycles to the network and are rewarded accordingly. The tokenomics are designed to foster utility-driven demand, incorporating a buyback and burn mechanism that reportedly funnels a significant portion of application revenues back into token purchases. This deflationary design presents a strong fundamental bullish case, contingent on usage scaling: real compute demand directly translates to revenue, which in turn fuels token burns, leading to scarcity. Numerous ecosystem write-ups and launch reports consistently highlight this revenue allocation strategy and the TIME token mechanism for node rewards. ​Since its listing, $BLESS has experienced dramatic price movements, including an initial surge past $0.10 followed by sharp retracements. After this early speculative frenzy, the price has consolidated into a tighter range. Key support is identified near $0.030–$0.033, while immediate resistance bands are observed around $0.034–$0.0368. A more substantial resistance zone lies between $0.059–$0.065, a level that would signify a return to earlier bullish momentum. The market cap remains in the low-tens of millions, with exact figures varying across trackers. Critically, the Vol / MktCap ratio is high, suggesting that the market is still driven by liquidity and speculative trading rather than gradual, organic accumulation. ​For a detailed K-line (candlestick) analysis, we turn to TradingView listings, which provide live charts and technical summaries for BLESS pairs (USDT/USD/USDC) across multiple timeframes: 15-minute, 4-hour, and daily. On the 15-minute chart, price action reveals repeated probes down to the $0.030–$0.031 zone, consistently met with quick recoveries, characterized by short wicks and rapid bounces. This indicates active short-term buying at support and substantial intraday liquidity at the lower end of the range. Frequent small-body candles with tails, such as spinning tops or pin bars, suggest market indecision alongside defensive buying at the lows. Successful breakout attempts would be confirmed by large green 15-minute bodies accompanied by significant volume spikes. The intraday bias leans neutral-to-bullish as long as the price sustains above $0.030 and continues to form higher lows. ​Shifting to the 4-hour chart for a swing and tactical view, a more constructive higher-low structure is evident. Recent swing lows are incrementally higher, indicating that the price is coiling into a tighter range and establishing a short-term ascending bias. The 21-period Exponential Moving Average (EMA) on the 4-hour chart has flattened and begun a shallow upward slope, often an early indicator that shorter-term momentum is attempting to reverse. TradingView's market pages and on-chart volume display occasional 4-hour candles with volume exceeding 2–3 times the EMA average. These "whale" or liquidity-event candles frequently precede rapid directional moves when confirmed by subsequent candlestick action. A clear bullish activation signal would be a 4-hour close above $0.038 on high volume. The price is currently forming a rectangular coil between approximately $0.030 and $0.038; a decisive 4-hour breakout, either above or below this range, will determine the next swing direction. ​From a daily perspective, which offers a view of the overall trend and market regime, the K-line illustrates a wide early range post-listing, characterized by a spike to its all-time high followed by a deep retracement, now transitioning into consolidation—a classic pattern of post-listing volatility evolving into price compression. The daily moving averages remain dynamic, and until the price secures consistent daily closes above established resistance bands, the overall trend cannot be definitively labeled as bullish. Key daily triggers include a sustained daily close above the $0.045–$0.06 cluster, which would signal renewed regime strength. Conversely, daily closes below $0.030 with increasing volume would likely initiate a deeper corrective phase, potentially pushing the price back towards lower support zones around $0.02. Market participants should treat daily closes as higher-probability confirmations. Actionable candlestick cues include bullish confirmation via a 4-hour or daily bull body engulfing prior consolidation on volume expansion (at least double the recent average), serving as an ideal add zone. A warning sign for a bull trap would be volume-light green candles breaking resistance but failing to close above it, a common occurrence in meme or early tokens, always requiring volume follow-through. Bearish confirmation would be a 4-hour or daily close below $0.030 with increasing volume, signaling an appropriate time to exit or reduce exposure. ​Contextual on-chain and flow signals provide further insights. Reports from whale trackers and market analysts have highlighted large transfers and active deposit patterns into exchanges preceding significant intraday moves. These activities suggest that whales are either positioning themselves or preparing liquidity for larger trades. When combined with the volume surges observed on TradingView charts, these flows can either presage short squeezes or indicate imminent sell pressure if executed as dumps. Traders should actively track exchange inflows through whale trackers like Arkham or Nansen alongside chart volume for comprehensive confirmation. ​In synthesis, this analysis provides actionable insights for various types of traders and holders. Short-term traders will find the 4-hour timeframe most conducive for tactical entries, suggesting buying bounces near $0.030 with tight stop-losses, or awaiting a volume-confirmed 4-hour breakout above $0.038. It is crucial to respect intraday volume signals to avoid potential traps. Swing or position traders are advised to consider layered entries and strategic profit-taking near the $0.05–$0.07 cluster, unless their conviction is rooted in long-term adoption metrics such as mainnet usage, node growth, and verifiable revenue burns. Long-term backers should prioritize monitoring these adoption metrics and the transparency of revenue/burn mechanisms, acknowledging that price volatility may persist regardless of fundamentals until real usage scales and buybacks become demonstrably verifiable. ​In conclusion, $BLESS presents a compelling fusion of a strong narrative—decentralized edge compute—with tokenomics designed for powerful impact if genuine demand materializes. The K-line story on TradingView clearly illustrates a market in a state of coil: higher lows on the 4-hour chart, robust short-term support around $0.030, and distinct volume-driven triggers that will ultimately dictate the next significant move. The current range should be approached as a critical decision box. Vigilance towards volume, decisive 4-hour and daily closes, and on-chain flows will be paramount in distinguishing a genuine breakout from mere speculative hype author:Crypto_navigtor
USDC-0.02%
BLESS-14.74%
CryptoChase
CryptoChase
2025/09/17 22:37
#GBPUSD 🎯 We caught the perfect top on GBP/USD today during the FOMC meeting. Cutting the rates typically causes the $DXY to decrease. In this scenario, right down into a double bottom [Range lows], hitting extreme discount. General rule: "Never trade the 1st move" Using this as a confluence, I took the risk for DXY to go back up shortly after the quick fall. I've already taken a profit and SL2BE, and now I'm letting the rest of the position run.
MOVE+0.02%
QUICK+2.51%
K A L E O |
K A L E O |
2025/09/17 21:02
$SUI / USD chart also looks ready to explode
LOOKS+5.11%
SUI+0.44%
Bpay-News
Bpay-News
2025/09/17 19:39
Plasma Partners with Rain Cards to Launch Cryptocurrency Payment Card, Allowing Spending of Plasma USD₮ at 150 Million Merchants Worldwide

USDからJPYへの交換

USD
JPY
1 USD = 0.002542 JPY。現在の1 United States Dollar(USD)からJPYへの交換価格は0.002542です。このレートはあくまで参考としてご活用ください。
Bitgetは、主要取引プラットフォームの中で最も低い取引手数料を提供しています。VIPレベルが高ければ高いほど、より有利なレートが適用されます。

USDの各種資料

United States Dollarの評価
4.6
100の評価
コントラクト:
63qr9x...RbzvRrC(Solana)
リンク:

United States Dollar(USD)のような暗号資産でできることは?

簡単入金&即時出金買って増やし、売って利益を得ようアービトラージのための現物取引ハイリスク・ハイリターンの先物取引安定した金利で受動的収入を得ようWeb3ウォレットで資産を‌送金しよう

United States Dollarの購入方法は?

最初のUnited States Dollarをすぐに手に入れる方法を学びましょう。
チュートリアルを見る

United States Dollarの売却方法は?

すぐにUnited States Dollarを現金化する方法を学びましょう。
チュートリアルを見る

United States Dollarとは?United States Dollarの仕組みは?

United States Dollarは人気の暗号資産です。ピアツーピアの分散型通貨であるため、金融機関やその他の仲介業者などの中央集権型機関を必要とせず、誰でもUnited States Dollarの保管、送金、受取が可能です。
もっと見る

United States Dollarのグローバル価格

現在、United States Dollarは他の通貨の価値でいくらですか?最終更新:2025-10-18 08:11:24(UTC+0)

もっと購入する

よくあるご質問

United States Dollarの現在の価格はいくらですか?

United States Dollarのライブ価格は¥0(USD/JPY)で、現在の時価総額は¥25,422,062.68 JPYです。United States Dollarの価値は、暗号資産市場の24時間365日休みない動きにより、頻繁に変動します。United States Dollarのリアルタイムでの現在価格とその履歴データは、Bitgetで閲覧可能です。

United States Dollarの24時間取引量は?

過去24時間で、United States Dollarの取引量は¥0.00です。

United States Dollarの過去最高値はいくらですか?

United States Dollar の過去最高値は--です。この過去最高値は、United States Dollarがローンチされて以来の最高値です。

BitgetでUnited States Dollarを購入できますか?

はい、United States Dollarは現在、Bitgetの取引所で利用できます。より詳細な手順については、お役立ちunited-states-dollarの購入方法 ガイドをご覧ください。

United States Dollarに投資して安定した収入を得ることはできますか?

もちろん、Bitgetは戦略的取引プラットフォームを提供し、インテリジェントな取引Botで取引を自動化し、利益を得ることができます。

United States Dollarを最も安く購入できるのはどこですか?

戦略的取引プラットフォームがBitget取引所でご利用いただけるようになりました。Bitgetは、トレーダーが確実に利益を得られるよう、業界トップクラスの取引手数料と流動性を提供しています。

‌注目のキャンペーン

暗号資産はどこで購入できますか?

Bitgetアプリで暗号資産を購入する
数分で登録し、クレジットカードまたは銀行振込で暗号資産を購入できます。
Download Bitget APP on Google PlayDownload Bitget APP on AppStore
Bitgetで取引する
Bitgetに暗号資産を入金し、高い流動性と低い取引手数料をご活用ください。

動画セクション - 素早く認証を終えて、素早く取引へ

play cover
Bitgetで本人確認(KYC認証)を完了し、詐欺から身を守る方法
1. Bitgetアカウントにログインします。
2. Bitgetにまだアカウントをお持ちでない方は、アカウント作成方法のチュートリアルをご覧ください。
3. プロフィールアイコンにカーソルを合わせ、「未認証」をクリックし、「認証する」をクリックしてください。
4. 発行国または地域と身分証の種類を選択し、指示に従ってください。
5. 「モバイル認証」または「PC」をご希望に応じて選択してください。
6. 個人情報を入力し、身分証明書のコピーを提出し、自撮りで撮影してください。
7. 申請書を提出すれば、本人確認(KYC認証)は完了です。
United States Dollarを1 JPYで購入
新規Bitgetユーザー向け6,200 USDT相当のウェルカムパック!
今すぐUnited States Dollarを購入
Bitgetを介してオンラインでUnited States Dollarを購入することを含む暗号資産投資は、市場リスクを伴います。Bitgetでは、簡単で便利な購入方法を提供しており、取引所で提供している各暗号資産について、ユーザーに十分な情報を提供するよう努力しています。ただし、United States Dollarの購入によって生じる結果については、当社は責任を負いかねます。このページおよび含まれる情報は、特定の暗号資産を推奨するものではありません。