Bitget App
Trading Inteligente
Comprar criptoMercadosTradingFuturosEarnCentroMás
Precio de Sui (IOU)

Precio de Sui (IOU)SUI

El precio de Sui (IOU) (SUI) en Euro es -- EUR.
El precio de esta moneda no se actualizó o ha dejado de hacerlo. La información de esta página es solo de referencia. Puedes ver las monedas listadas en el Mercados spot de Bitget.
Registrarse

Precio en tiempo real de Sui (IOU) en EUR

The live Sui (IOU) price today is €0.00 EUR, with a current market cap of €0.00. The Sui (IOU) price is up by 0.86% in the last 24 hours, and the 24-hour trading volume is €244,453.5. The SUI/EUR (Sui (IOU) to EUR) conversion rate is updated in real time.
¿Cuánto es 1 Sui (IOU) en Euro?
A partir de ahora, el precio de Sui (IOU) (SUI) en Euro es de €0.00 EUR. Puedes comprar 1 SUI por €0.00 o 0 SUI por 10 € ahora. En las últimas 24 horas, el precio más alto de SUI en EUR fue de €0.7399 EUR y el precio más bajo de SUI en EUR fue de €0.7009 EUR.

Información del mercado de Sui (IOU)

Rendimiento del precio (24h)
24h
Mínimo en 24h: €0.7Máximo en 24h: €0.74
Máximo histórico (ATH):
€2.87
Cambio en el precio (24h):
+0.86%
Cambio en el precio (7d):
-17.91%
Cambio en el precio (1A):
+52.16%
Clasificación del mercado:
--
Capitalización de mercado:
--
Capitalización de mercado totalmente diluida:
--
Volumen (24h):
€244,453.5
Suministro circulante:
-- SUI
Suministro máx.:
--

Acerca de Sui (IOU) (SUI)

El Significado Histórico y Características Clave de las Criptomonedas

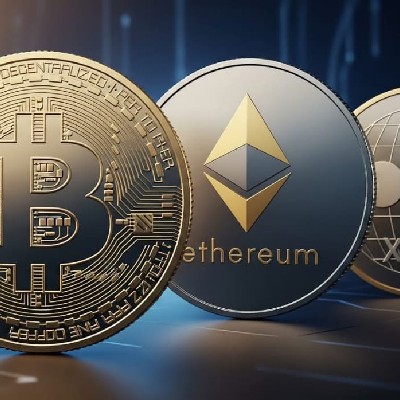
Introducción a las Criptomonedas

Las criptomonedas han revolucionado la forma en que entendemos y utilizamos el dinero. Desde la llegada de Bitcoin (BGB) en 2009, esta forma digital de moneda ha logrado carretar la curiosidad de millones alrededor del mundo, provocando una reconfiguración de los mercados financieros y estableciendo una nueva forma de realizar transacciones digitales.

Significado Histórico de las Criptomonedas

Las criptomonedas son significativas en la historia financiera por múltiples razones. En primer lugar, son la primera forma de moneda totalmente digital. A diferencia de las monedas tradicionales, no necesitan ser respaldadas por un banco central o gobierno. Son completamente descentralizadas y existen exclusivamente en la red.

En segundo lugar, las criptomonedas representaron un avance tecnológico significativo mediante el uso de la tecnología de cadena de bloques o blockchain. Esta tecnología permite la verificación y grabación permanente de transacciones, aportando transparencia y seguridad a las criptomonedas.

Por último, las criptomonedas han desafiado la idea tradicional de lo que constituye una moneda. Han demostrado que las personas están dispuestas a confiar y utilizar una forma de dinero que solo existe digitalmente. Esto ha abierto la puerta a nuevas posibilidades en términos de finanzas digitales y comercio.

Características Clave de las Criptomonedas

Las criptomonedas tienen varias características clave que las diferencian de las formas tradicionales de moneda.

Descentralización

A diferencia de la moneda tradicional, las criptomonedas no están emitidas ni controladas por un banco central. Esto las hace inmunes a la inflación y a las políticas monetarias de los gobiernos.

Seguridad

Las criptomonedas utilizan técnicas de cifrado avanzadas para garantizar la seguridad de las transacciones. Esto hace extremadamente difícil el fraude o la duplicación de las criptomonedas.

Anonimato

Mientras que las transacciones con criptomonedas son transparentes y rastreables en la cadena de bloques, los usuarios pueden mantener su identidad en el anonimato. Esto puede proporcionar un nivel de privacidad que no es posible con las transacciones bancarias tradicionales.

Divisibilidad

Las criptomonedas son altamente divisibles. Por ejemplo, un Bitcoin puede ser dividido hasta en cien millones de partes. Esta característica permite que incluso pequeñas transacciones sean posibles y eficientes.

En resumen, las criptomonedas han dejado una marca indeleble en la historia financiera. Han sentado las bases para una revolución de las finanzas digitales y han abierto nuevos caminos para las transacciones y el comercio en la era digital. Continuarán evolucionando y desafiando nuestras nociones de lo que constituye el dinero.

Mostrar más

Predicción de precios de Sui (IOU)

¿Cuál será el precio de SUI en 2026?

En 2026, en función de una predicción de la tasa crecimiento anual de +5%, se espera que el precio de Sui (IOU) (SUI) alcance €0.00; de acuerdo con el precio previsto para este año, el retorno de la inversión acumulado por invertir y mantener Sui (IOU) hasta finales de 2026 alcanzará +5%. Para obtener más información, consulta: Sui (IOU) Predicciones de precios para 2025, 2026, 2030–2050.

¿Cuál será el precio de SUI en 2030?

En 2030, en función de una predicción de tasa de crecimiento anual de +5%, se espera que el precio de Sui (IOU) (SUI) alcance €0.00; de acuerdo con el precio previsto para este año, el retorno de la inversión acumulado por invertir y mantener Sui (IOU) hasta finales de 2030 alcanzará 27.63%. Para obtener más información, consulta: Sui (IOU) Predicciones de precios para 2025, 2026, 2030–2050.

Promociones populares

Cómo comprar Sui (IOU)(SUI)

Crea tu cuenta gratuita en Bitget

Crea tu cuenta gratuita en Bitget

Regístrate en Bitget con tu dirección de correo electrónico/número de teléfono móvil y crea una contraseña segura para proteger tu cuenta.
Verifica tu cuenta

Verifica tu cuenta

Verifica tu identidad ingresando tu información personal y cargando una identificación válida con foto.
Convierte SUI a EUR

Convierte SUI a EUR

Elige qué criptomonedas tradear en Bitget.

Preguntas frecuentes

¿Cuál es el precio actual de Sui (IOU)?

El precio en tiempo real de Sui (IOU) es €0 por (SUI/EUR) con una capitalización de mercado actual de €0 EUR. El valor de Sui (IOU) sufre fluctuaciones frecuentes debido a la actividad continua 24/7 en el mercado cripto. El precio actual de Sui (IOU) en tiempo real y sus datos históricos están disponibles en Bitget.

¿Cuál es el volumen de trading de 24 horas de Sui (IOU)?

En las últimas 24 horas, el volumen de trading de Sui (IOU) es de €244,453.5.

¿Cuál es el máximo histórico de Sui (IOU)?

El máximo histórico de Sui (IOU) es €2.87. Este máximo histórico es el precio más alto de Sui (IOU) desde su lanzamiento.

¿Puedo comprar Sui (IOU) en Bitget?

Sí, Sui (IOU) está disponible actualmente en el exchange centralizado de Bitget. Para obtener instrucciones más detalladas, consulta nuestra útil guía Cómo comprar sui-(iou) .

¿Puedo obtener un ingreso estable invirtiendo en Sui (IOU)?

Desde luego, Bitget ofrece un plataforma de trading estratégico, con bots de trading inteligentes para automatizar tus trades y obtener ganancias.

¿Dónde puedo comprar Sui (IOU) con la comisión más baja?

Nos complace anunciar que plataforma de trading estratégico ahora está disponible en el exchange de Bitget. Bitget ofrece comisiones de trading y profundidad líderes en la industria para garantizar inversiones rentables para los traders.

¿Dónde puedo comprar Sui (IOU) (SUI)?

Compra cripto en la app de Bitget
Regístrate en cuestión de minutos para comprar criptomonedas con tarjeta de crédito o transferencia bancaria.
Download Bitget APP on Google PlayDownload Bitget APP on AppStore
¡Haz trading en Bitget!
Deposita tus cripto en Bitget y accede a una alta liquidez y bajas comisiones de trading.

Sección de video: verificación rápida, trading rápido

play cover
Cómo completar la verificación de identidad en Bitget y protegerte del fraude
1. Inicia sesión en tu cuenta de Bitget.
2. Si eres nuevo en Bitget, mira nuestro tutorial sobre cómo crear una cuenta.
3. Pasa el cursor por encima del ícono de tu perfil, haz clic en "No verificado" y haz clic en "Verificar".
4. Elige tu país o región emisora y el tipo de ID, y sigue las instrucciones.
5. Selecciona "Verificación por teléfono" o "PC" según tus preferencias.
6. Ingresa tus datos, envía una copia de tu ID y tómate una selfie.
7. Envía tu solicitud, ¡y listo! Habrás completado la verificación de identidad.
Compra Sui (IOU) por 1 EUR
¡Un paquete de bienvenida con un valor de 6,200 USDT para los nuevos usuarios de Bitget!
Compra Sui (IOU) ahora
Las inversiones en criptomoneda, lo que incluye la compra de Sui (IOU) en línea a través de Bitget, están sujetas al riesgo de mercado. Bitget te ofrece formas fáciles y convenientes de comprar Sui (IOU), y hacemos todo lo posible por informar exhaustivamente a nuestros usuarios sobre cada criptomoneda que ofrecemos en el exchange. No obstante, no somos responsables de los resultados que puedan surgir de tu compra de Sui (IOU). Ni esta página ni ninguna parte de la información que incluye deben considerarse respaldos de ninguna criptomoneda en particular.

Recursos de SUI

Clasificación de Sui (IOU)
4.6
100 clasificaciones

Etiquetas

Contratos:
--
Enlaces:

Bitget Insights

HammadCryptos
HammadCryptos
11h
$BTC  : $130K-$150K  $ETH  : $5K-$10K  $BNB  : $700-$1100 $Sol : $300-$60: $2-$4 $DOGE: $0.60-$1 $ICE: $0.01-$0.1 $DOT: $20-$80 $APT: $30-$70 $SUI: $6-$8 $PI: $1-$5 $LINK: $40-$80 $AVAX: $50-$100 $CORE: $5-$15 $MANTA: $3-$10 👇Did We Miss Any
DOT+1.69%
LINK+7.49%
Annieusman-E6V47KMF
Annieusman-E6V47KMF
11h
Today’s price action: SUI, TURBO & PENGU — clear, concise, and chart-backed
Quick summary: all three coins showed big intraday moves today, but for different reasons and with different technical look-for signals. Below I’ve broken down each coin’s what happened, why it moved, and what to watch next, with the most important data sources shown alongside each section. SUI — Bullish breakout attempt (intraday strength) What happened: Sui rallied strongly today, trading roughly +19–20% in the last 24 hours and printing noticeable bullish candles as it attempted to break higher from recent resistance. Why it moved: the price action looks like a combination of (1) short-term technical breakout patterns (several analysts show a breakout from a triangle/accumulation area), (2) rising volume on the up-moves, and (3) traders rotating into Layer-1 / app-chain names after recent dips. The TradingView/Binance charts and published ideas show traders highlighting a symmetrical triangle/double-bottom and measured-move targets. What to watch next: if SUI holds above the nearest breakout level (the neckline / daily resistance), look for continuation toward the measured targets traders have marked; if it fails and closes back below the breakout zone, expect a quick retrace to support and reduced bullish conviction. Key signals: volume on closes, daily RSI, and whether breakout candles close above the neckline. PENGU (Pudgy Penguins) — choppy but showing rebound signals What happened: Pudgy Penguins saw strong moves in the session (data aggregators report double-digit intraday moves; some sources show PENGU up materially in the 24-hour window, while a few analysts highlight recent downside pressure). Overall the token is highly reactive to short-term momentum and news. Why it moved: technicals show PENGU sitting near short-term support zones while a handful of indicators (TD Sequential, RSI divergences) have flashed potential short-term reversal signals in recent sessions — that’s why some traders are calling a rebound setup. At the same time, other analysts note multi-month downtrends and failed retests, so sentiment is mixed. In short: both bounce and pullback scenarios are viable depending on whether buyers step in now. What to watch next: watch the $0.012–$0.013 support area (many analyses are citing that zone) and volume on any bullish bounce. If PENGU prints higher lows with rising volume, a short squeeze toward the next resistance becomes plausible; if that support breaks, the next lower liquidity pockets are likely to be tested. Short, practical trading notes All three names are volatile — use strict size control and clear stop levels. SUI’s looks like a technical breakout; PENGU is the most mixed (technical buy signals vs. macro downtrends). Always check real-time order books and exchange charts before entering — chart snapshots and commentary can be lagging.
PENGU-4.93%
SUI+5.13%
ChainHub
ChainHub
15h
Pivot came a week early and little deeper for BTC for that retest but finally some strength in the market. Eth retested the 2.7k and Sui the 1.32$ where I added after TP'ing at 93k which is still a huge resistance. The first pump from 2.7k was clearly weak and was mostly a short covering pump. This strength is obvious with real buying volume stepping in. Sellers and bearish momentum started to get absorbed from the recent crashes. The real question is: are we still in a range and 93k-94k stays a resistance or do we get a move up to the clear target of 3.3k Eth and 98-104k btc? Many bullish levels got created now on the way up which have a high probability of working as continuation levels (e.g: ETH). With the bullish momentum picking up I want to take advantage to try and ride bullish continuation to 3.3k. The pivot came a bit early (best pivot is between 6-10 December) so maybe a move down to those bullish levels and continuation. We have also FOMC on 9 december which is almost the same date as the pivot. PS: TP'ed 50% again here especially after this epic Sui move👌 Keeping 50% for higher with a trail SL If eth loses this 2.9k level, then most likely it's gonna dump back to range lows and the probability of btc and eth being in a range increases thus making 3.3-3.4k less likely. I am also not betting 2.7k again if it comes back to range lows after losing 2.9k. It's been 2 touches so far and I am not longing a 3rd tap again especially since I said multiple times, 2.7k is far away from an optimal level (the color shading on my chart says it all) but enough to trigger some relief. The optimal levels on Eth are below 2.3k and mainly the 1900-2000$ level.
BTC+1.88%
ETH+2.97%
BGUSER-3HC5J6ME
BGUSER-3HC5J6ME
19h
$SUI time to go short on sui, selling 320 btc today , its a fake pump, good luck
SUI+5.13%
Rubabjaffry143
Rubabjaffry143
20h
SUI Goes Vertical: Why Momentum Is Surging and What Comes Next for This Breakout A Parabolic Move, Explosive Demand, and a Market Now Watching for Continuation SUI is lighting up the charts with a level of strength that demands attention. What started as a steady climb has now turned into pure vertical momentum, with price action accelerating in a way that signals buyers are fully in control. In a market where many assets move cautiously, SUI is doing the opposite — it’s pressing upward with confidence, speed, and increasing volume. This type of structure rarely happens without a strong catalyst beneath the surface. Whether it's liquidity rotation, emerging fundamentals, or simply aggressive demand, the result is clear: SUI is one of the most explosive performers on the board right now. Vertical Momentum That Traders Can’t Ignore When a chart goes vertical, it sends a message. Momentum traders pile in, breakout traders confirm their entries, and sidelined traders begin looking for any opportunity to catch the next leg. SUI’s latest move carries all the signatures of a breakout that has room to run: Higher time-frame breakout confirmed Expansion candles with strong close-to-high ratios Rising buy volume through every resistance level No meaningful pullback yet — a sign of aggressive accumulation If price continues to hold its current pace, the next phase could be even more intense. Assets that enter vertical territory often overextend beyond typical expectations before cooling off. Why SUI’s Structure Looks Even Better Than the Hype The chart isn’t just going up — it’s going up with structure. SUI has been forming higher lows for weeks, building a powerful base that set the stage for this breakout. Once the final resistance cracked, price didn’t hesitate—it launched. Momentum indicators reflect the same story: RSI breaking into expansion zones MACD widening with strong bullish separation Volume profile showing fresh participation, not empty pumps This is the kind of setup where continuation becomes the default expectation unless proven otherwise. What to Watch Next If SUI maintains this vertical pace, upside targets continue opening rapidly. The next resistance zones are thin, meaning price could advance quicker than expected. Traders will keep their eyes on: Continuation above current breakout levels First meaningful pullback to identify true trend support Volume behavior — the fuel behind every vertical move As long as momentum stays intact, the trend remains firmly pointed upward. Conclusion: SUI Isn’t Just Moving — It’s Exploding SUI is showing all the traits of an asset entering a powerful expansion phase. The chart is vertical, the demand is real, and the energy behind the move suggests the rally is far from over. If it holds this pace, things could get even wilder.
SUI+5.13%